This is a microservice-architecture-based web application consisting of four modules: Processor, Collector and two Web modules, on server side (backend) and UI module on client side (frontend). Application collects weather data from external services, shows it on the map of Ukraine graphically and also in the weather table textually.
All backend modules are implemented in Java with Spring Boot technology. Web UI is implemented with Angular 8 framework.
Processor is the main module which communicates with others through the command interface. The communication is done via Hazelcast distributed network with messages sent between modules. Processor module uses PostgreSQL database to store data and sends it to clients. It is implemented with Hibernate framework, Spring Data JPA and Liquibase technologies.
Collector module collects weather data from external services. It uses OpenWeatherMap as the primary data provider and Dark Sky as a reserve provider. The module runs several tasks such as: a hourly task to renew the current weather, a daily task to get the five-day forecast as well as sunrise/sunset information and a daily task to sweep out old data from the database. The task scheduling is implemented with Quartz framework. REST requests to the services are prepared with Apache HttpComponents. Jackson framework is used for data parsing.
The backend Web module is a REST server for UI. It handles requests from web UI, does data boxing and, if necessary, converts Processor output data. The backend Web module contains Spring simple controller and some Scala code for data processing and converting. The external data providers can refresh the weather forecasts as rarely as once per 3 hours. That’s why the backend Web module interpolates Processor output data to get the forecast for every hour.
Web UI running in user’s web browser sends REST requests to the server (to backend Web module) and gets responses in JSON format. The main technologies used in frontend are Angular 8 for general user interface (e.g. the table with weather content) and Angular Google Maps for the map with weather markers. Bootstrap framework and TypeScript language are used. The user interface is multilingual: English, Ukrainian and Russian languages are supported (ng-translate library is used).
Web UI module supports all major web browsers except Internet Explorer.
For application deployment, Docker containers are used (4 containers for the modules and a container for the database). Web container contains nginx web server for routing requests between web UI module and web backend modules. The website is hosted on Amazon EC2 with c5.large instance type.
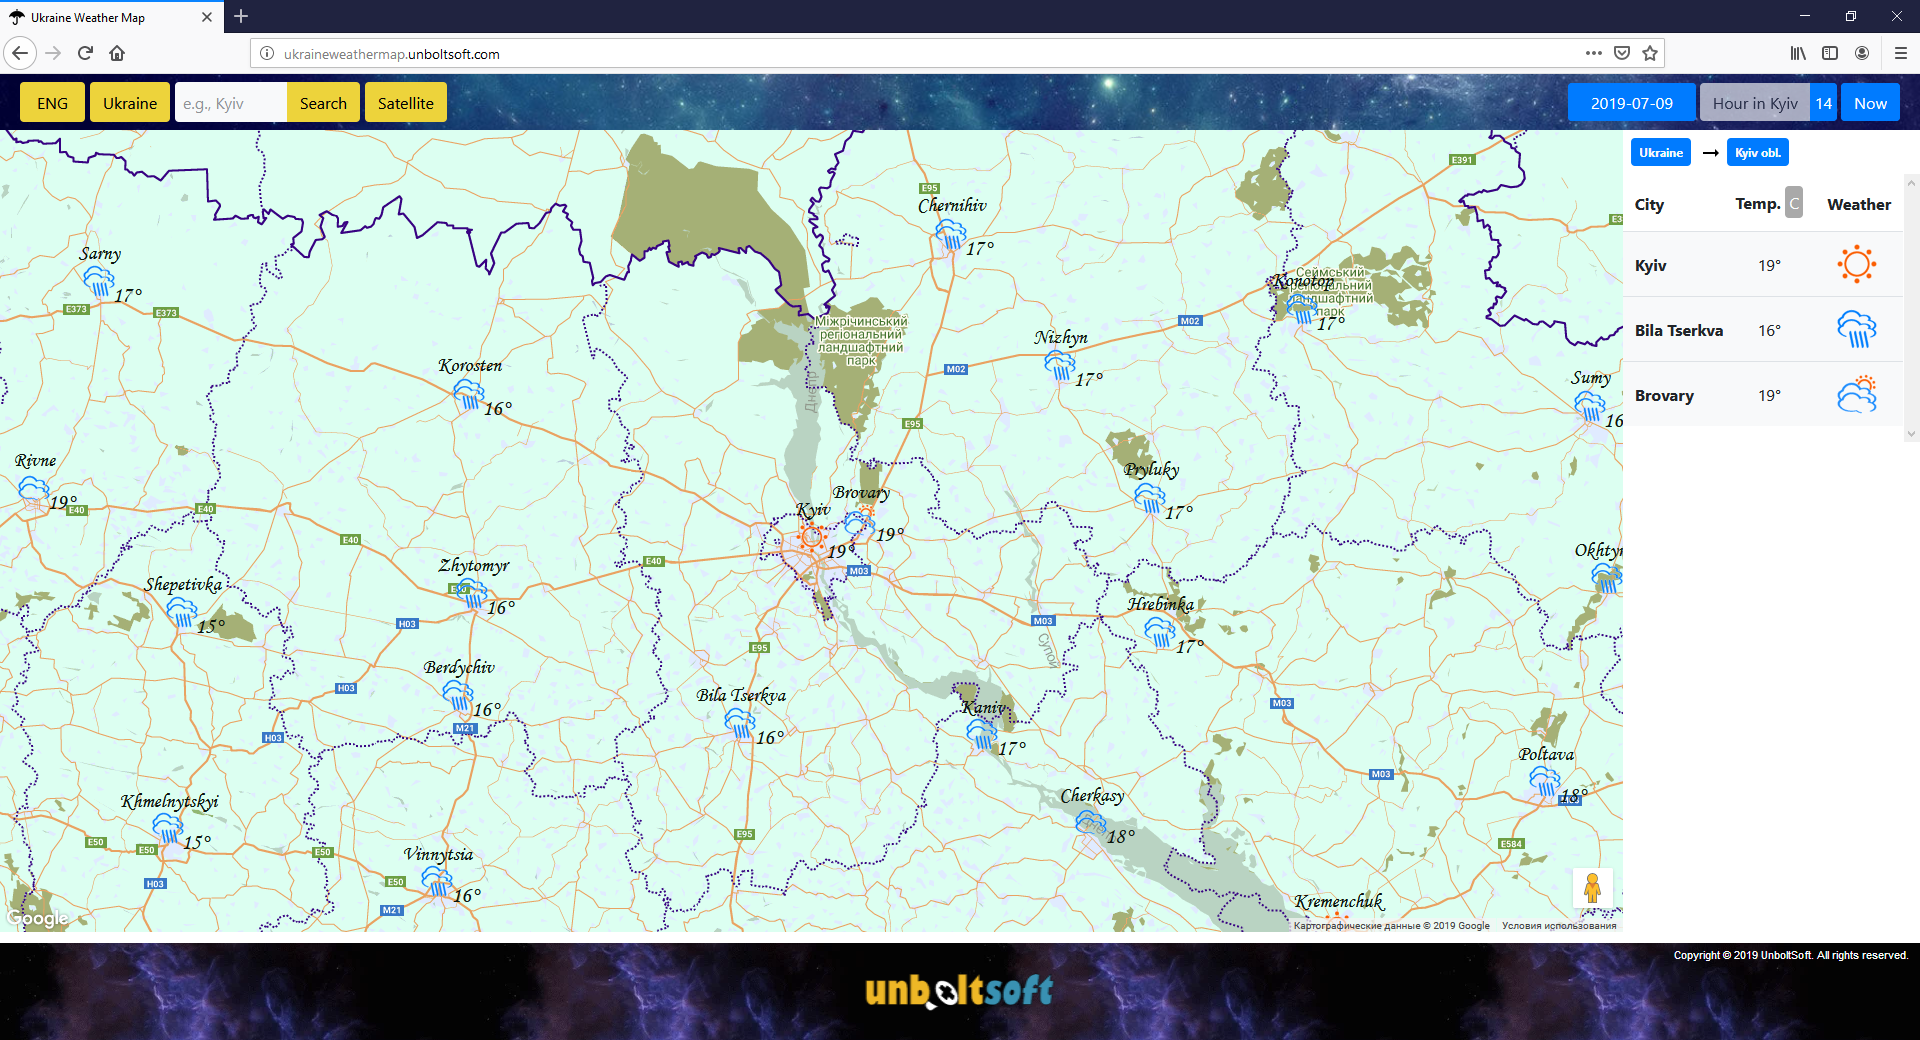
The user interface looks like that:

The web page consists of the header with navigation buttons and fields, the body and the footer with logo. The body contains Ukraine map with weather markers at left-hand side and a table with weather data at right-hand side.
First of all, you can click the drop-down list in the header to choose your preferred interface language. (All text on the map as well as in the table will be translated.)
By clicking on a region marker on the map or by scrolling up the wheel, you can make the map closer so that cities become shown. A click on a region in the table switches you to the list of cities for this region:
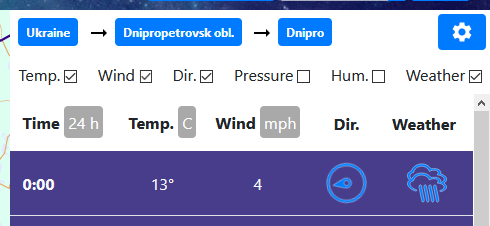
After clicking a city marker on the map or a city row in the table, the map centers on the city, and you can see a detailed hourly weather table for the selected day. The table provides information about temperature, wind speed, wind direction, pressure, humidity, precipitation and cloudiness. You can switch measurment units and time format clicking on appropriate buttons. The information about sunrise and sunset time is used to shade data rows in the table and choose proper icon set. The table header provides buttons to switch time format and measuring units.

User can customize the shown and hidden columns for the 3rd-level table by clicking on the gear button:
You can use the search field to find a city. All major Ukrainian cities are supported. If the city is found, the map will be centered and zoomed to the city, and you will see its weather data for the selected day in the table. The “Ukraine” button can be used to reset the focus back to the whole Ukraine map.
The website supports two map types: the road map and the satellite view. You can click the “Map/Satellite” button to switch between them:

The buttons at the upper-right corner allow you to choose the date (with the calendar) and the time (with the time picker) to show the weather for. Note that the website uses Eastern European Time (Kyiv). You can go up to five days forward or backward from the current day. The “Now” button resets the date and time so that the weather will be shown for the present moment.

There is an option to store all user preferences in cookies, e.g., display language, measuring units, time format, hidden columns, etc.
Languages: Java, Scala, TypeScript
______________________________
“Everyone should learn to program a computer. Everyone should learn a computer language because it teaches you how to think.”
